

My Infographic
The final infographic for project 9
What is My Story?
Identifying the story represented within my infographic
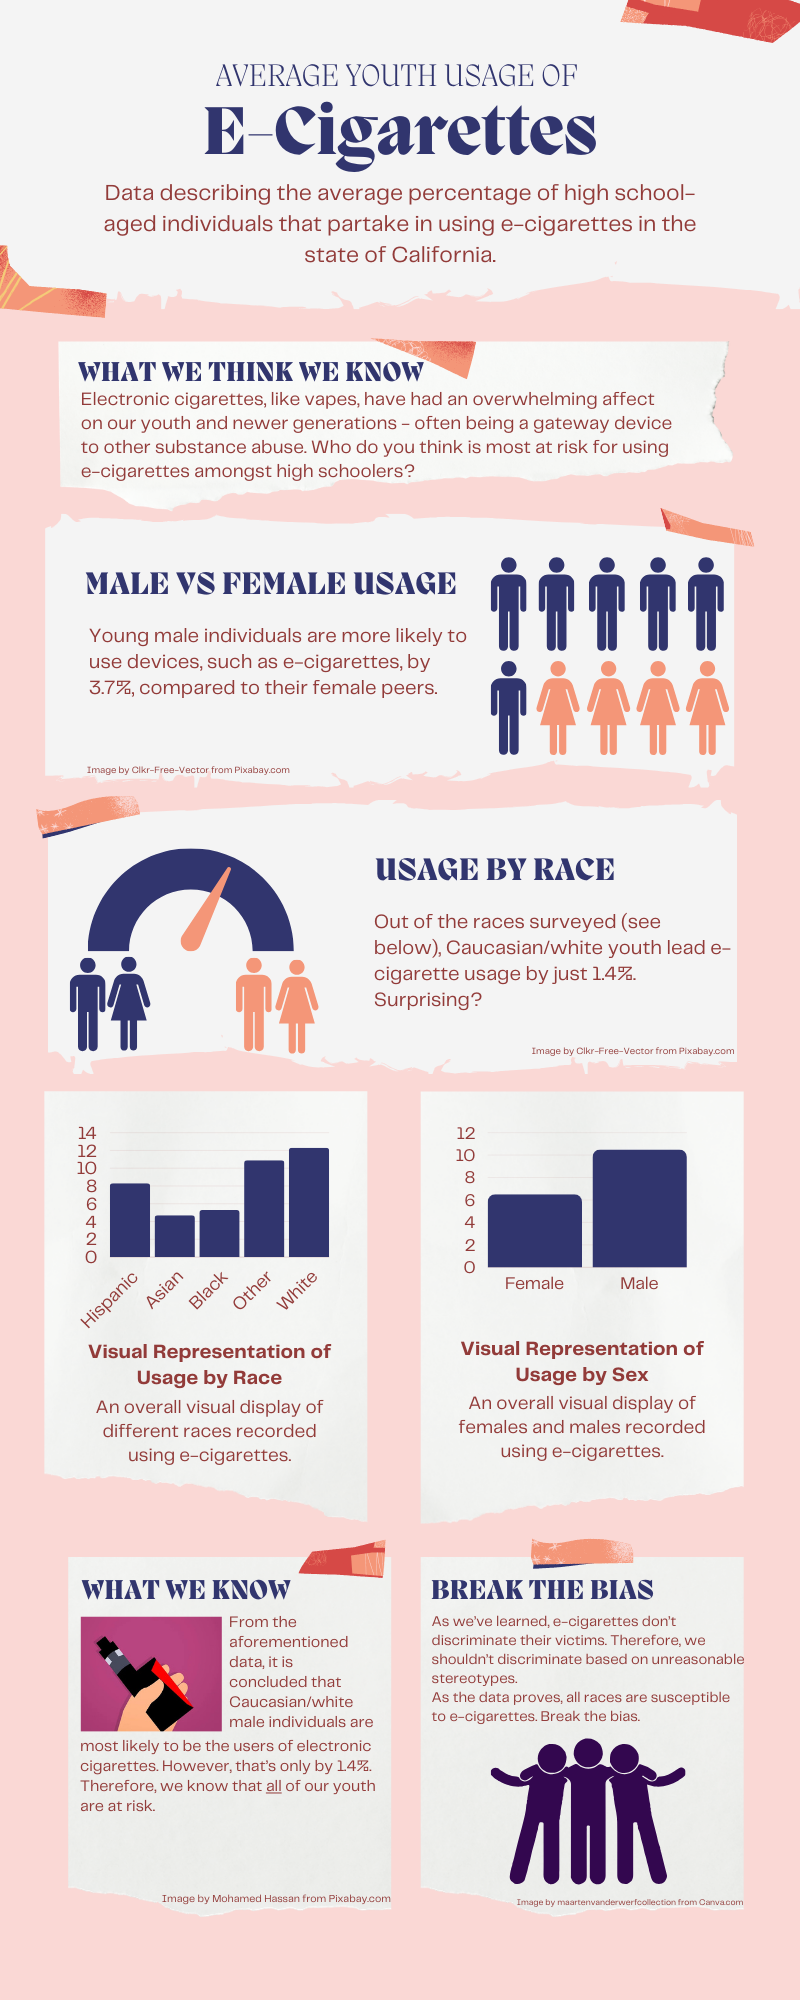
My data showcased ratios of electronic cigarette usage within high school-aged individuals located in California. The data I decided to isolate are race and sex based. I wished to have my data guide my story in the fact that we hold unreasonable stereotypes in many social situations. However, as a society, we hold “deviant” acts highly when considering these racial stereotypes. Therefore, I wanted my data and infographic to tell the story that, despite what we are told to believe by society, usage of e-cigarettes actually defy these ideals. In fact, it is white males that are most likely to partake in using electronic cigarettes. However, this is only by a small percentage. So, e-cigarettes (which are believed to be a gateway device to more dangerous substances) don’t discriminate, so neither should we when considering this. Thus, we need to break the bias.
To further inspect the data reflected in the infographic, you can visit the exact dataset I chose at Data.gov!
Why an Infographic?
Why I decided on an infographic to tell my story
I’ve made infographics for past classes, and I love the way they simply display data without missing any important aspects. Therefore, I felt that with my specific isolated components, that an infographic would perfectly display these elements, and leave myself room to pinpoint the story I wished to tell, and how the data related to the story.
How I Did It!
How I made the infographic and visual representations
I made the whole infographic using Canva.com, along with all of the data charts. However, although many of the images can be found directly from Canva’s website, many of the resources are actually rooted from Pixabay.com, and other free-source websites. Canva was very straight-forward to use, as many of the visuals were easy to drag, drop and move around. Additionally, I love using Canva for many projects, academically and otherwise, because Canva also produces all of the visual representations from the internet all in one place. However, as aforementioned, it’s always crucial to double-check where these images actually came from.
Attributions and Credits
Giving credit to all of the resources I used!


Image by maartenvanderwerfcollection from Canva.com